Georgia Produces $64K of Economic Output per Resident

Staff Report

Thursday, March 9th, 2023

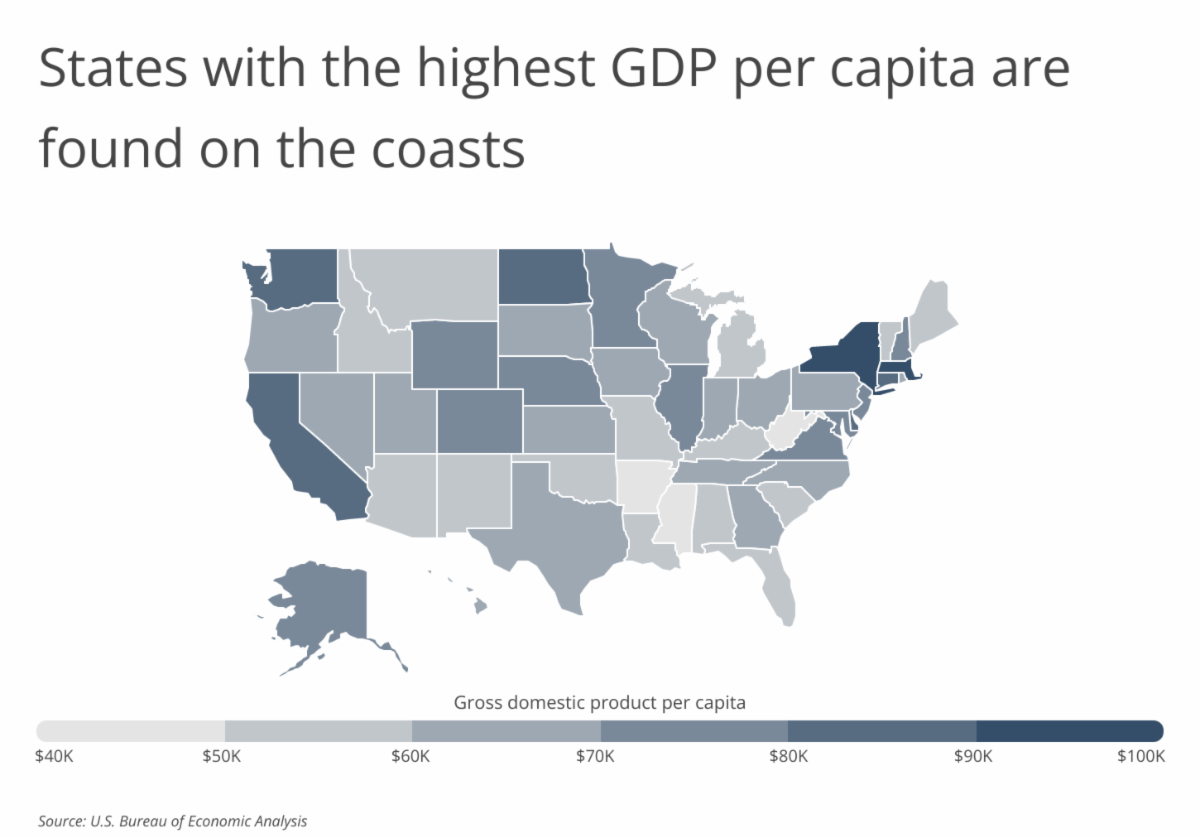
The COVID-19 pandemic dramatically shifted the economic landscape in the United States, and the effects are still lingering. These repercussions have been felt around the world, and their effects have altered local economies as well. In areas where remote work increased, considerations around transit, zoning laws, taxes, and broadband internet have taken center stage. In addition to changing office culture, the popularity of remote work is helping to transform the economic map as hundreds of thousands of Americans have left coastal cities like New York and San Francisco to live in more affordable locations in southern or mountain states. Meanwhile, after persistent supply chain disruptions, there has been a resurgent emphasis on domestic manufacturing, impacting certain areas of the country more than others.

With fluctuating economic changes across the U.S., it’s difficult to gauge how the country is recovering as a whole, as well as how local economies are faring. Fortunately, one way to measure the virus’s economic impact is through gross domestic product (GDP).


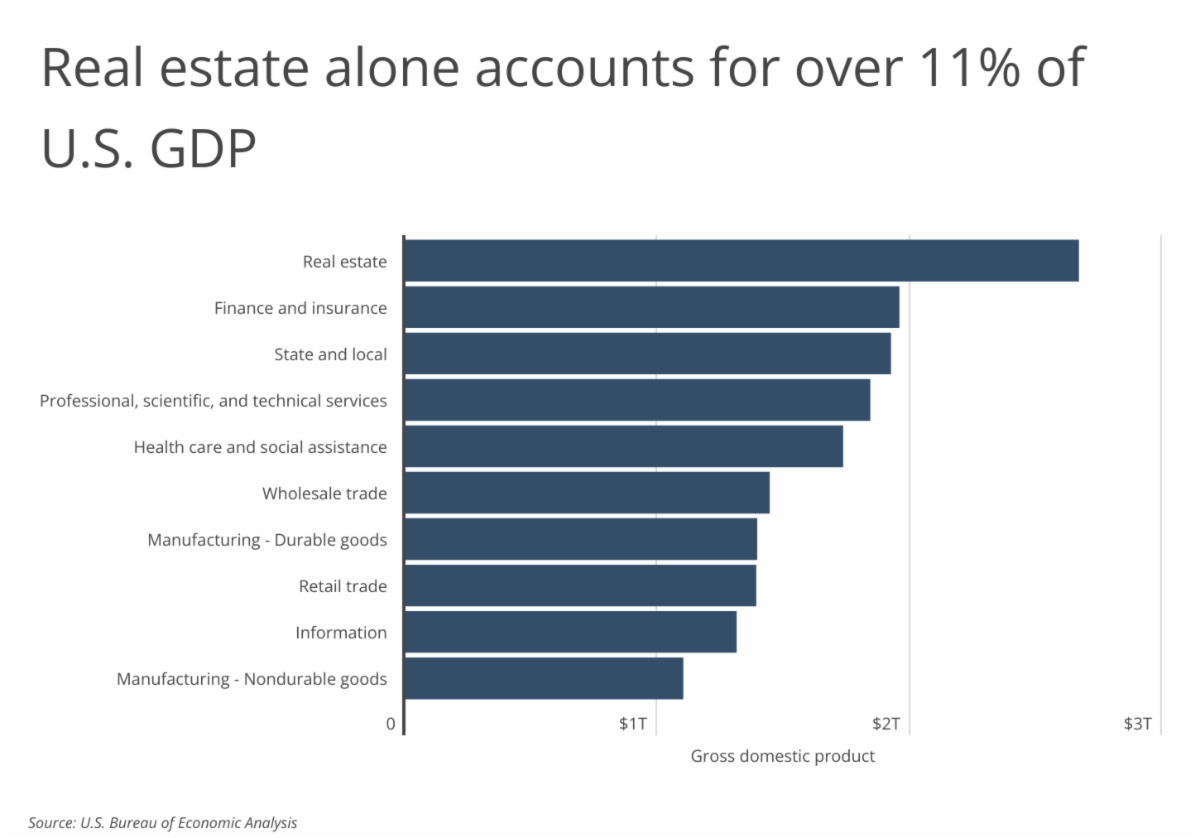
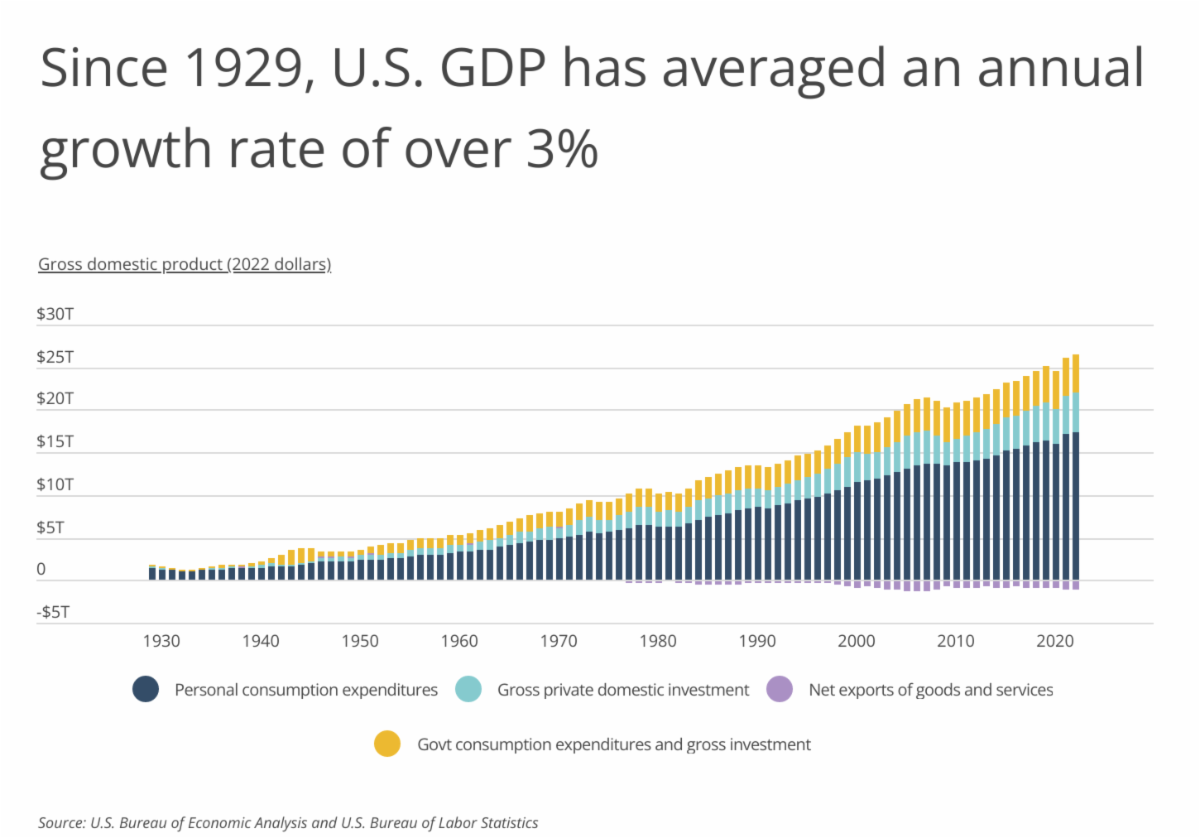
GDP is the value of all goods and services produced in an economy, and in the U.S., its path since the onset of the COVID-19 pandemic provides the most basic measure of the virus’s impact on the economy. Although U.S. GDP has averaged an annual inflation-adjusted growth rate of over 3% since 1929, the pandemic caused historic drops in 2020. Real GDP dropped 2.7% from 2019 to 2020. Prior to 2020, the last time GDP fell was in 2009 during the Great Recession, decreasing 1.6% from 2008. And before that, a drop in GDP had not occurred since the early 1980s.

While U.S. GDP in aggregate decreased from 2019 to 2020, gross private domestic investments decreased by 5.5% and the trade deficit grew by 7.1%. Personal consumption expenditures decreased by 3.1%, while government consumption expenditures and gross investment actually increased by 3.2%. Fortunately, the U.S. is showing signs of recovery, with a 5.7% increase in GDP from 2020 to 2021, and a smaller yet still noteworthy 1.1% increase from 2021 to 2022.


While total GDP includes consumer spending, business spending, government spending, and international trade, contributions to GDP vary widely by industry. In 2021, real estate alone accounted for over 11% of U.S. GDP, amounting to over $2.6 trillion in economic activity. The next largest industry was finance and insurance, which accounted for 8.4% of U.S. GDP. State and local government spending was not far behind in third, making up 8.3% of U.S. GDP. Manufacturing of non-durable goods contributed the least of all industry groups, but still made up 4.7% of U.S. GDP.


GDP can vary dramatically by location, and the states with the highest GDP per capita are found on the east and west coasts. New York leads in GDP per capita at $95,851, with Massachusetts and Washington coming in second and third, at $91,819 and $87,546 respectively. California is not far behind with the fourth-highest GDP per capita, producing $85,969 of economic output per resident. Coastal access is vital for international trade, with more than 90% of world trade using sea routes to transport goods back and forth. Millions of jobs are also directly dependent on the resources of the oceans and Great Lakes, so it makes sense that the majority of large U.S. metros with the biggest economies are also on the coasts, or bordering Lake Superior or Lake Michigan.

Collectively, southeastern states have lower GDP per capita, with five southeastern states including South Carolina, Alabama, Arkansas, West Virginia, and Mississippi falling in the bottom 20% of all 50 states. Mississippi has the lowest GDP per capita at $43,156—less than half the GDP per capita of New York.

The data used in this analysis is from the U.S. Bureau of Economic Analysis. To determine the locations with the largest economies, researchers at Smartest Dollar calculated the gross domestic product per capita. In the event of a tie, the location with the greater total gross domestic product was ranked higher.

Here is a summary of the data for Georgia:

  • Gross domestic product per capita: $64,042

  • Total gross domestic product: $691,626,900,000

  • Private industry gross domestic product: $615,218,800,000

  • Government gross domestic product: $76,408,100,000

  • Personal income per capita: $55,786

For reference, here are the statistics for the entire United States:

  • Gross domestic product per capita: $70,249

  • Total gross domestic product: $23,315,081,000,000

  • Private industry gross domestic product: $20,502,200,000,000

  • Government gross domestic product: $2,812,880,000,000

  • Personal income per capita: $64,143

For more information, a detailed methodology, and complete results, you can find the original report on Smartest Dollar’s website: https://smartestdollar.com/research/cities-with-the-largest-economies-2023